Workflows in EASE enabled by the Acousteer real-time simulation engine
The release of EASE 5 Third Edition marks a transformative moment in acoustic simulation, unlocking opportunities and workflows that were previously unimaginable. At the heart of this leap forward lies its groundbreaking feature: the Acousteer calculation engine. Acousteer recalculates audience area mappings in milliseconds, delivering real-time feedback on any adjustments to your 3D model or sound system. This innovation redefines acoustic simulation, shifting the process from iterative guesswork to dynamic exploration.

A new era of interactivity
EASE 5 seamlessly integrates real-time mapping within the same workspace used to edit 3D geometries and loudspeaker configurations. Any change is immediately reflected across single or multiple 3D views, creating a dynamic, interactive design environment. The absence of waiting time means every idea, no matter how unconventional, can be tested instantly. This speed invites creative experimentation while dramatically enhancing the precision and efficiency of your designs.
In the following sections, we will show how this new level of interactivity redefines or enhances the workflows we’ve relied on for years. The key concept is enabling mapping from the very beginning, even before finalizing a meaningful speaker layout. This brings unparalleled benefits to speed and significant advantages to design accuracy. Not having to wait for any updates also allows learning much more intuitively how the sound field depends on the room and system configuration. While we highlight the most obvious applications below, we also encourage users to explore further on their own. Real-time simulation, as a new technology, still holds a big undiscovered potential.
While Acousteer currently focuses on real-time SPL mapping, future releases of EASE 5 will expand its capabilities to many acoustic parameters, further broadening its impact and scope.
Redefining workflows
1. Loudspeaker selection made simple
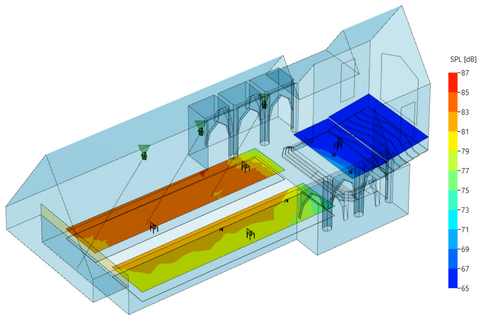
When adding loudspeakers to your model, you can immediately see their SPL projections on the audience area, making it easy to identify and address unacceptable coverage. For instance, in pursuit of better STI in a reflective room, you can quickly test loudspeakers with narrower directivity in real time, switching between different models or manufacturers as needed. See the illustration below:
🚫 Loudspeaker with coverage angles: 90° x 40°
High likelihood of strong reflections off the side wall, reducing the STI.
More influence on the adjacent audience area, possibly causing slap delays.
✅ Swapped to loudspeaker with coverage angles: 60° x 60°
Precise targeting of the audience area with less contribution from wall reflections, resulting in better STI.
Much less influence on the adjacent audience area.
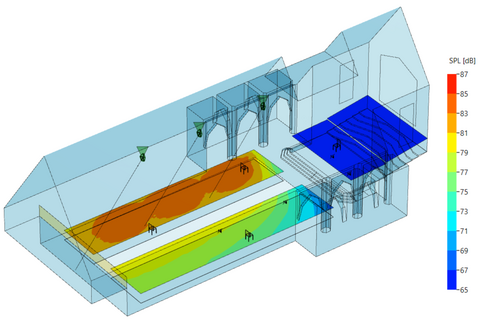
Mappings are shown as Isoline Plot with 2 dB color steps at 4 kHz, 1 octave band
2. Loudspeaker configuration in minutes
Experimenting with line-array or cluster setups becomes seamless as you see coverage updates live. Quickly narrow your choices to the most accurate options, reducing the need for more time-consuming ray tracing analyses. For example, in the early stages of designing a sound system for a football stadium, a single array configuration is typically tested before distributing similar units across the tribunes. In the example below, real-time SPL mapping made it possible to adjust the initial setup in a few minutes. By leveraging available gain headroom and using a fast trial-and-error approach to reposition the array farther away, the design proceeded with a configuration reduced by two boxes, significantly lowering the total sound system cost.
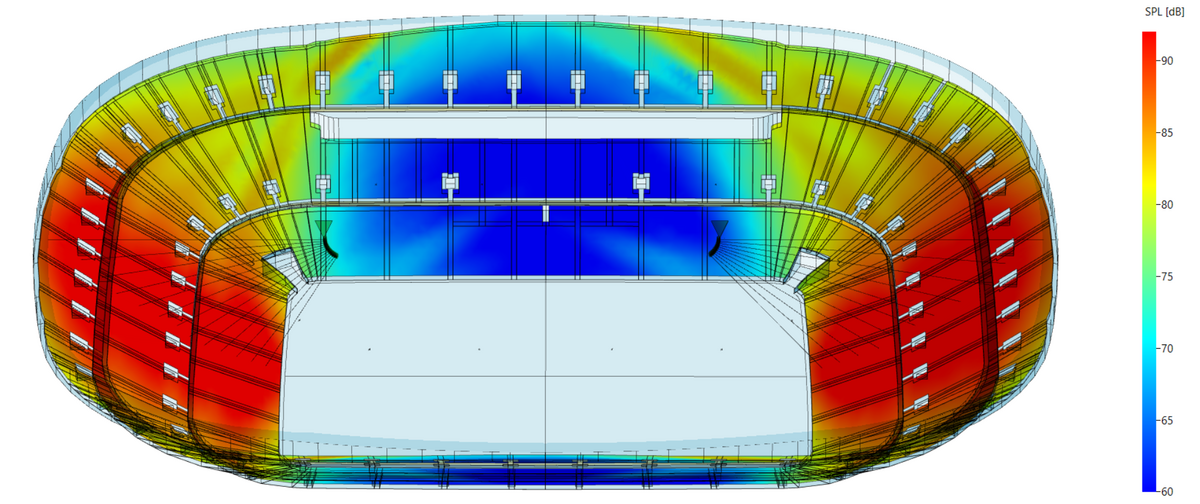
Mappings are shown as Patch Grid (smooth color transition) at 1 kHz, 1 octave band
3. Finding the perfect loudspeaker count
Covering large or extended areas - whether it’s concert stage front fills, delay lines, or stadium tribunes - no longer requires guesswork. Real-time mapping allows you to experimentally evaluate solutions for the number and positioning of loudspeakers instantly, saving significant time and effort. In this example, the front fills for the music hall were intended to cover the parterre audience area. Before aligning them with the main arrays, determining the optimal number of front fills was straightforward. By focusing the mapping calculations solely on the front fills and displaying their coverage on an isoline plot, the ideal quantity was easily identified by duplicating and moving the units while tracking the progress live.
🚫 4 front-fill loudspeakers are insufficient to provide adequate coverage within 6 dB variation.
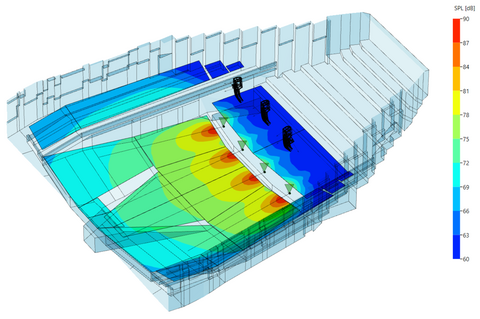
✅ 6 front-fill loudspeakers provide accurate coverage.

Mappings are shown as Isoline Plot with 3 dB color steps at 4 kHz, 1 octave band. The target range is represented by 2 steps from 81 to 87 dB.
6. Comparing solutions effortlessly
With multiple instances of EASE open, you can compare design solutions across displays and fine-tune them side by side. Even within a single instance, you can toggle between grouped loudspeaker setups to explore options instantly, enabling faster decision-making.

Mappings are shown as Patch Grid (smooth color transition) at 1 kHz, 1 octave band
7. Enhancing collaboration and client engagement
EASE 5 Third Edition fosters new levels of collaboration and communication. Whether working with clients, team members, or external specialists, the ability to adjust designs in real time changes the game. Show your client how changes affect coverage in a visually engaging, interactive environment. Discuss mounting possibilities, aim angles, or system layouts while seamlessly incorporating feedback. From refining public address systems in airports to designing immersive audio for theaters, EASE 5 empowers you to explore, demonstrate, and validate designs live. Whether in person or remote, you can confidently explain and support your choices, bridging the gap between concept and execution.
Additionally, when working with mapping displays, consider leveraging the Isoline Plot instead of the Patch Grid. The Isoline Plot allows you to set precise step sizes and visualize the exact borders of acoustic values to make informed decisions. For presentation purposes, however, switching back to the Patch Grid may allow understanding qualitative aspects more easily and provide a visually appealing display.

Mappings are shown as Isoline Plot with 2 dB steps (left) and Patch Grid (right) at 63 Hz, 1 octave band
The future of acoustic simulation
EASE 5 Third Edition and the Acousteer engine set a new benchmark for speed, interactivity, and creativity in acoustic design. As real-time simulations become more advanced, adapt your workflows to harness their full potential. Explore, experiment, and innovate - you’re at the forefront of a new era.


